Answer what your funders ask, with numbers that hold up
Funders ask a familiar set of questions: how many people you served, what changed for them, how that compares with your plan, and who you reached. This page lays out what funders ask for, with sources, and where each answer appears in an OutcomeLens report. A director can share it with a board, and a funder can read it on their own.
Illustrative example. Sample data. The cover of a sample program report.
A short walk through one report
A program report stands on its own, with nothing to open or log into. Here is how one begins.
1 of 3
It opens with the program and how much stands behind it.
The program, its period, and how many people and assessments the report rests on, before any chart.
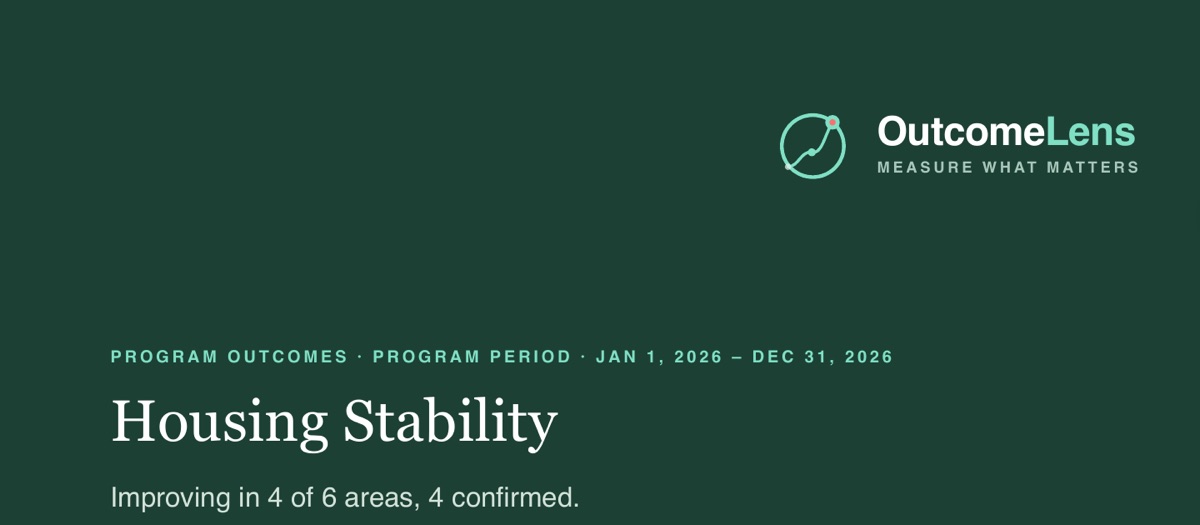
Program outcomes · Jan 1, 2026 to Dec 31, 2026
Housing Stability
Improving in 4 of 6 areas, 4 confirmed.
Solid Ground Community Partners · Prepared October 1, 2026
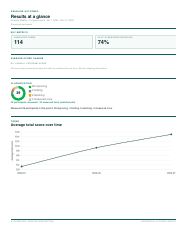
Participants
39
Areas
4 of 64 confirmed
Assessments
114completed in period
Illustrative example. Sample data. Recreated from a sample report.
2 of 3
Then one plain sentence, in the program's own words.
The program director writes the opening line. The counts beneath it come straight from the records.
In brief
So far this year, 35 of the 39 neighbors in Housing Stability have answered our housing questions at least twice, and all four measures we track (shelter, affordability, safety, and outlook) show change large enough to confirm.
Across federal grants, United Way, foundations, and corporate funders, the same requests come up again and again. Each one below names who asks, then shows where the answer sits in a report. Every funder's terms differ, so read their own; the sources are listed at the end of this page.
Change from where people started
Who asks: federal awards under the Uniform Guidance, HUD's annual performance report, WIOA workforce programs, United Way.
Funders want change measured against a starting point: at entry and exit, before and after, or months later.
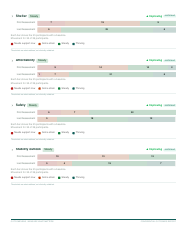
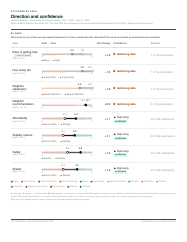
Outcomes by area
1Shelter
▲ Improving +1.4confirmed
2.13.5
05
Some strain → Steady · 35 of 39 participants
2Affordability
▲ Improving +1.1confirmed
2.33.4
05
Some strain → Steady · 35 of 39 participants
3Ease of getting help
+1.0Gathering data
2.01.0
50
Easy → Easy · 1 of 18 participants · lower is better
Illustrative example. Sample data. Recreated from a sample report.
1
The same people at both points First and now are averages for the same participants measured twice, and the sample sits beside every area.
2
Direction and confidence are separate Confirmed means the change is backed by a minimum sample and statistical checks, so it's unlikely to be noise.
3
Thin data says so An area with too few repeat answers reads Gathering data. Its movement still shows; the direction stays preliminary.
How many people reached the outcome
Who asks: nearly every funder, including WIOA, HUD, United Way, and most foundations.
Funders separate people served from people who changed, usually as a number and a percent.
Illustrative example. Sample data. Recreated from a sample report.
1
The count comes with the rate 29 of 39, printed beside the percent, so a reader sees who is counted.
2
Measured once is counted apart People with a single assessment can't show change yet, so they're never counted as not improving.
3
Declines in the same voice Holding and declining are reported plainly, beside the gains.
Targets compared with results
Who asks: federal awards (2 CFR 200.329 asks for reasons when goals aren't met), United Way projections, foundation report forms.
Funders compare what you planned with what happened, and ask why when a target is missed.
Goal attainment
Outcome areaTargetActualOf goalStatus
1ShelterPercent improving · goal period Jan 1, 2026 to Dec 31, 2026 · 35 of 39 assessed85%82.9%398%2↑ On track
Illustrative example. Sample data. Recreated from a sample report.
1
The target can't drift Goals are locked when the reporting window opens, so the target a program is measured against does not move.
2
On track, not met The window is still open, so the report says on track and waits.
3
Progress toward the target Percent of goal shows how far the outcome has moved toward its target.
Who you served
Who asks: HUD, WIOA, CDBG, United Way, and many private funders.
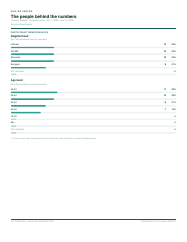
Funders ask who you reached, and more of them ask whether outcomes differ across groups. Their categories differ, so the breakdowns come from the fields your organization already keeps. In the app, segment analysis, part of the Impact edition, breaks outcomes down by group. Its charts show counts, never names, and flag any segment with fewer than 5 participants: "Small sample: interpret with caution."
Who we served
Neighborhood
138 of 39 participants have this recorded.
Hillcrest10 26%
Old Mill10 26%
Riverside10 26%
Eastgate8 21%
2Not recorded<5
"<5" means fewer than 5 participants. Exact counts that small are hidden to protect individual privacy.
Illustrative example. Sample data. Recreated from a sample report.
1
Missing data is visible The report says how many participants have each field recorded.
2
Small groups stay private Any demographic group with fewer than 5 participants shows as <5, with no exact count or percent.
Each person counted once
Who asks: United Way (eligible participants, all of them, not a prorated share), HUD (every table balances to total clients).
When people take part in more than one program, funders want to know how many people that is, not how many enrollments.
Who we measured, across programs
1Distinct participants
61
Program participations
98
In more than one program
32
2Each program is scored on its own instrument and scale. Both are named on that program's page, beside its chart. We never average scores across programs that measure different things.
Illustrative example. Sample data. Recreated from a sample report.
1
People and participations, side by side A person in two programs counts once in distinct participants but twice in participations.
2
No averages across instruments Each program keeps its own scale, so scores that measure different things are never blended.
What got in the way, in your words
Who asks: federal awards, foundation report forms, United Way.
Numbers don't explain themselves. Funders ask what got in the way and what you learned.
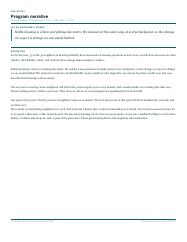
The story
In the program's words
1Not everyone is moving. Some neighbors still tell us they need support now to stay housed, and a small number are trending the other way. Those readings aren't verdicts on anyone. They show us where our case managers are spending their time this fall.
Illustrative example. Sample data. Recreated from a sample report.
1
Your program writes it The narrative is yours. The report prints it beside the numbers it describes.
2
A decline isn't a verdict When a measure slips, it points to something a program can act on, never a judgment of the people it serves.
One person's progress, shared with care
Many funders ask for a participant's story. A participant progress report shows one person's change across every area they've been assessed in, with the same confidence labels. It belongs to that person first. Share it only with their permission, and only what they're comfortable sharing.
Participant progress, Wren Castillo
Wren CastilloImproving in 4 of 12 areas. Based on 9 assessments over 10 months.
1Shelter
Improvingconfirmed
Steady
14
05
Needs support now → Steady · Change exceeds the meaningful-change threshold (1).
2Ease of getting help
Holding steadyno change
Easy
1
50
Easy → Easy · Scale 0 to 5, lower is better.
3How today felt
In progress1 assessment
A good day
4
05
A good day · One assessment so far, so no trend is shown.
Illustrative example. Sample data. Recreated from a sample report.
1
Real change, not wobble Confirmed appears only when a change clears the measure's meaningful-change threshold.
2
Direction follows the measure When lower is better, the scale turns around, so right always means better.
3
No trend from one visit With a single assessment, the report says in progress and waits.
What the reports won't claim
These aren't funder rules. They're practices evaluators recommend, and they keep a report from saying more than its data can.
A trend from one assessment. A single reading shows as in progress.
An average across unlike measures. Programs scored on different instruments stay apart.
A demographic group small enough to recognize someone. Any demographic group with fewer than 5 participants shows as <5, with no exact count or percent.
That the program caused the change. A report shows what changed. What contributed is for your program to say, in its own words.
A verdict on a person. A measure declines. A person doesn't fail.
One report, more than one funder
Many private funders will accept a report you wrote for someone else. Of 96 funders the Center for Effective Philanthropy surveyed in 2025, a little more than two-thirds accept at least one other format, and 69 percent of those accept a report written for a different funder. Federal awards still use the forms each agency prescribes.
What it doesn't file
OutcomeLens doesn't produce federal submissions such as HUD's annual performance report, HMIS exports, or WIOA's quarterly participant records. It holds the outcome evidence and the narrative your staff draw on when they complete them. See what OutcomeLens doesn't do.
Sources
Where these funder requests come from
Research compiled October 2026. Requirements change; check each funder's current terms.