
For executives, program directors, and funders
Tell your program's story
You already do the work funders want to see. The hard part is proving it the same way twice. OutcomeLens measures outcomes from the work your staff already do, inside the Salesforce you already have, so your board, your funders, and your network hear one story.
One story, told the same way every time.
For the executive
Every number has one definition. Your dashboard, your funder report, and your board deck read from the same records, so they can't disagree. When someone asks why two reports differ, the answer is that they don't.
The headline is written for you. From the results, OutcomeLens writes the sentence you'd read aloud: direction first, then how sure you can be. Nobody types it.
Outcomes come from everyday work. A wage, a credit score, a check-in score becomes a before-and-after measure against each person's own starting point. Each area says how sure it is, in plain words: Gathering data, Early signal, Emerging, Confirmed. Thin data says so.
Change across the current fiscal year · Housing Stability
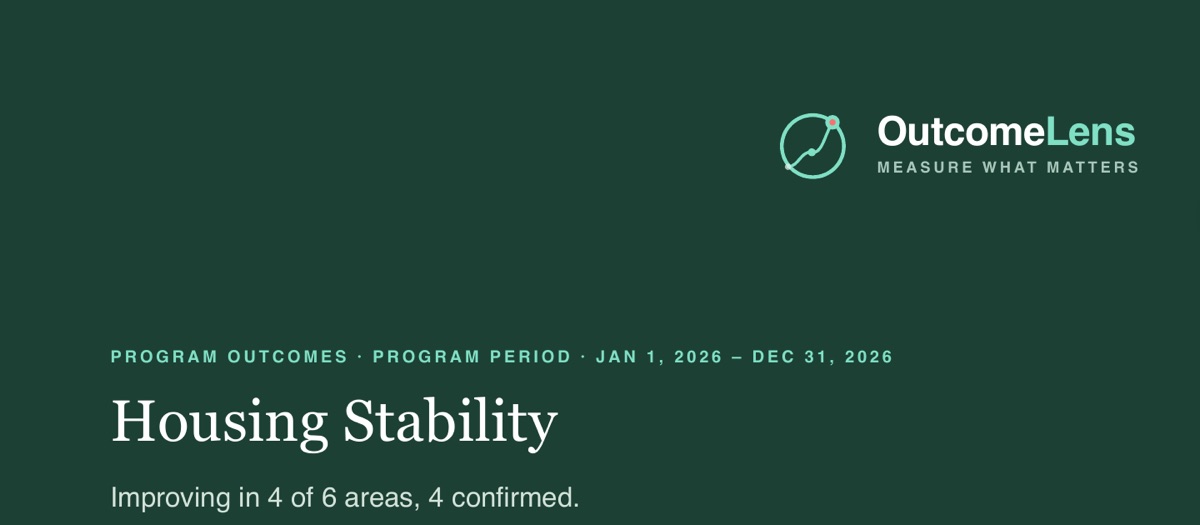
Improving in 4 of 6 areas, 4 confirmed. The year's shelter goal is on track.
- Participants
- 39
- 39 participants measured · 35 measured twice
- Areas
- 4 of 6 improving
- 4 confirmed
- Improving
- 29 of 39
- measured improving
- Goals
- 1 of 1 on track
- Shelter · 35 of 39 assessed
Follow-ups that send themselves.
For the program director
Say it once. "When someone enters the program, a baseline. A check-in every month while they're active. Ninety days after they leave, one more." A measurement plan holds that, and runs it, without anyone remembering or building automation.
It reaches people where they are. Each check-in goes by email or text, to the person's own phone, with nothing to sign in to. A person in two programs who gets the same form in the same month answers it once, and both programs count it.
You can see whether it's working. Every count sits beside what was expected: 41 of 52 this month, 3 still open. When someone wasn't reached, the plan says why, in your program's words, with the next step beside it. Never a red mark on a person's row.
Housing stability check-ins Active since Oct 1
| 34 people | Baseline | Check-ins | Exit | Follow-up |
|---|---|---|---|---|
| Jordan Rivera | ||||
| Sam Okafor | ||||
| Dana Whitfield | ||||
| Luis Romero | ||||
| 30 more | ||||
| Collected of expected | 30 of 311 still open | 41 of 523 still open | 6 of 7None open | 2 of 31 still open |
- collected
- due now
- we didn't collect it
- joined at go-live
Founding partners

SLCM Neighbor Network
Before OutcomeLens, intake meant staff filling out forms about a neighbor, and the most important parts of their journey lived in scattered spreadsheets. Today OutcomeLens enables client-led intake: neighbors tell us who they are and what they need, in their own words. That information flows straight onto one record with their assessments and care plan, so our navigators start every conversation already informed and nobody falls through the cracks. It has changed both how we work and how neighbors experience us.
Clare Wallace, Executive Director 
Louisville Urban League
Louisville Urban League has worked with Clint Majors for the better part of a decade. He helped us learn Salesforce from the ground up, led our move to the Nonprofit Success Pack, and became the person we turn to on nearly every data decision. When he started building OutcomeLens, we wanted to help shape it.
As a Founding Partner, we put our real programs in front of it: Jobs, Education, Housing and financial empowerment, Black Business, Expungement, Health, and Scholarship. Our feedback is in the product, and our new welcome form and program intakes are built on it.
What I value most is that OutcomeLens lives inside the Salesforce we already use. Nothing new to log into, nothing to export. The work our staff do every day becomes the outcomes story we tell our funders and the National Urban League.
Chabela Sánchez, Chief Data Officer
Reports your funders can read.
For the funder, and for you when they ask
Four reports, from the same records. Form Summary, Participant Progress, Program Outcomes, and, with Impact, Portfolio Outcomes across every program. Each one stands on its own, with nothing to open or log into: the number of people beside every rate, the scale and dates on the page, thin data flagged.
Is change reaching everyone you serve? Segment Explorer, part of Impact, shows outcomes by site, cohort, or group. Charts show counts, never names, and flag any segment under 5 for caution. In printed reports, a group that small shows as "<5." Experience measures such as satisfaction sit beside your outcomes and are never blended into them.
What it won't say. That your program caused the change. A group small enough to recognize someone. An average across measures that shouldn't be averaged. A verdict on a person.
Bring this page to your board, with what funders ask for and where each answer appears. Or talk with us about your program.